
Library · Standards · File 01
What is sustainable architecture? Core principles and the buildings of the future
Five principles — embodied carbon, operational energy, waste, circularity and the life-cycle view — set out with sourced numbers, seven technical drawings and four data tables.
Last reviewed — Updated to the 2025/2026 Global Status Report; Passivhaus PER criterion and sources [01] [03] [07] corrected
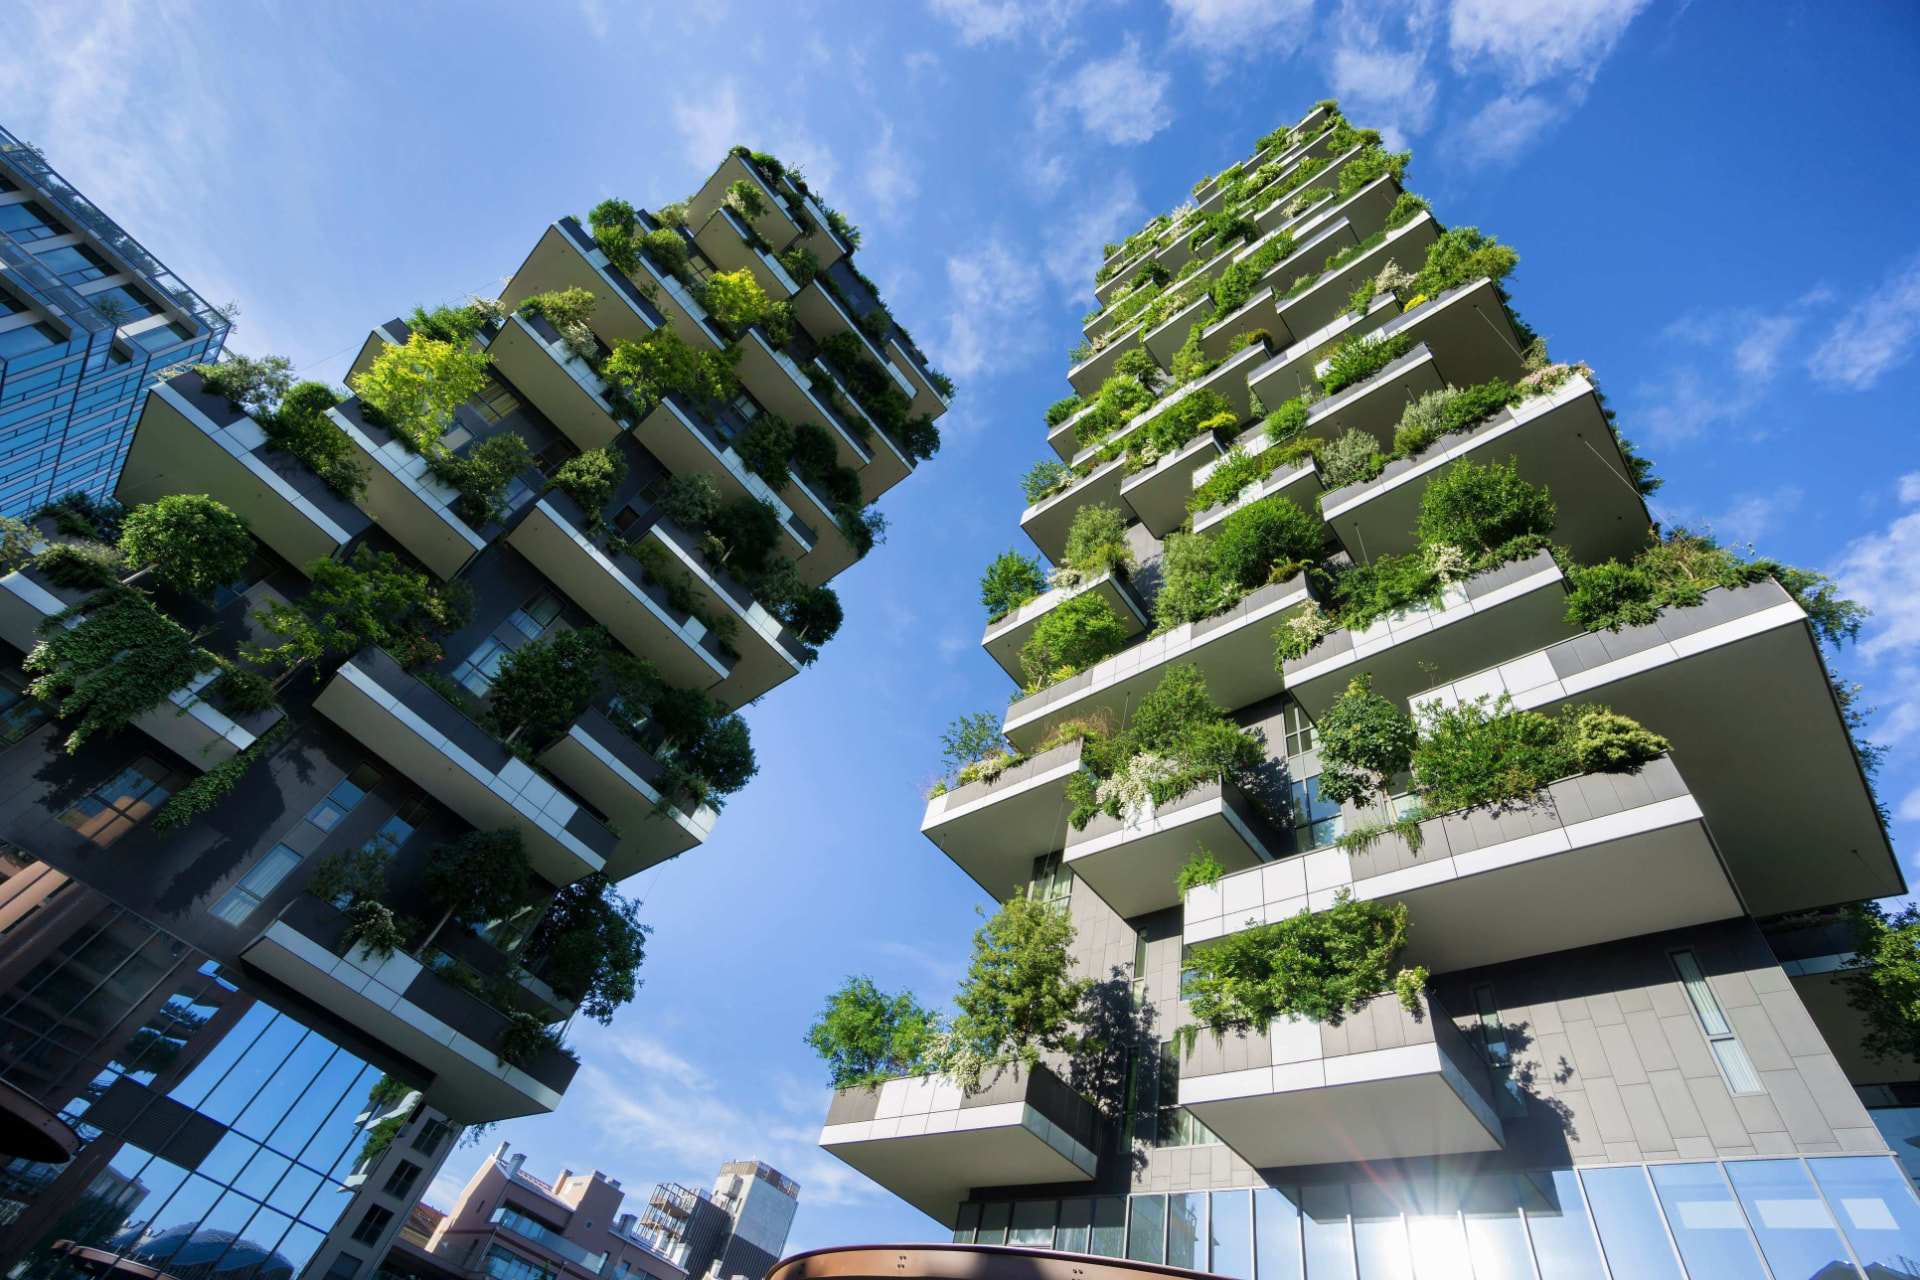
37% of global CO₂ (2024) · ≈50% of material extraction · 11–13% of global GDP
Every wall we raise and every cubic metre of concrete we pour keeps spending energy and carbon for decades. So what actually makes a building sustainable — a marketing label, or measurable numbers? This article defines sustainable architecture and unpacks its five core principles with real, sourced data. The aim is decision-ready knowledge, not slogans.
What is sustainable architecture?#
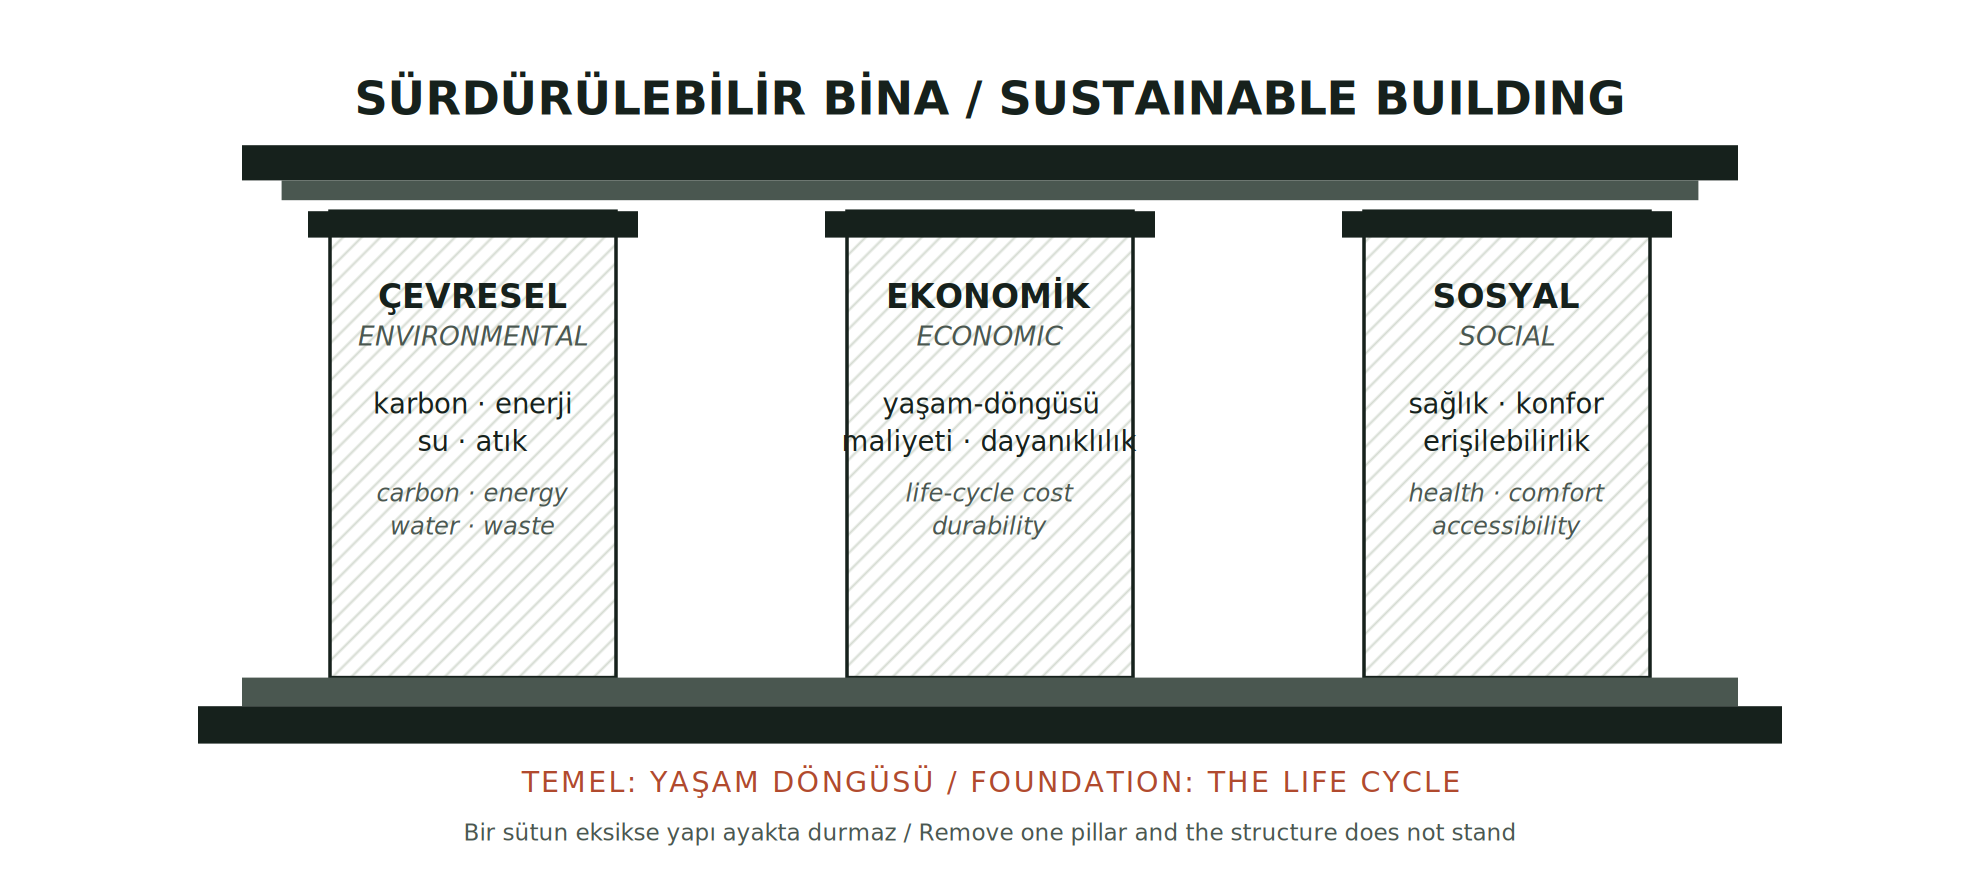
Sustainable architecture is a holistic design approach that minimises a building's environmental impact across its whole life cycle — raw-material extraction, manufacture, construction, use and demolition — while delivering healthy, comfortable interiors. It rests on three pillars: environmental, economic and social sustainability. A building becomes genuinely sustainable, rather than merely green, only when it performs well on all three at once.
Why does it matter so much? The current edition of UNEP and GlobalABC's Global Status Report for Buildings and Construction — the 2025/2026 edition, published 19 May 2026 — puts the sector at around 37% of global CO₂ emissions and nearly 50% of global material extraction, alongside 11–13% of global GDP and about 9% of the world's workforce. Over the past decade global building energy intensity has fallen 8.5% and green building certifications have nearly tripled, yet investment in energy efficiency must reach US$5.9 trillion by 2030 to stay on a net-zero pathway. The previous edition, 2024/2025, reported 32% of global final energy and 34% of global CO₂ for 2023, with cement and steel alone accounting for 18% of global emissions.
SOURCE DISCREPANCY — THE CO₂ SHARE MOVES. The 2022 edition gave 37% of energy and process-related CO₂; the 2024/2025 edition gave 34% for 2023; the 2025/2026 edition gives around 37% again, for 2024. The figure moves with scope — whether cement, steel and other process emissions are counted inside the sector — and with reporting year, not because the sector's emissions swung by three points. We quote the current edition and name the vintage. The energy side is not directly comparable either: the 2024/2025 edition reported 32% of global final energy for buildings operation in 2023, GlobalABC's summary of the 2025/2026 edition cites 28% of global energy consumption, and UNEP's own page for the 2025/2026 edition gives no headline energy share at all. We therefore keep any energy figure attached to the edition and year it comes from.
Principle 1 — Embodied carbon#
A building's carbon splits into operational carbon (heating, cooling and power in use) and embodied carbon (producing, transporting, building with and disposing of materials). Regulations focused on operational energy for decades; yet embodied carbon is emitted on day one of construction and cannot be clawed back. Material choice governs it directly.
Table 1 — Embodied carbon of structural materials (A1–A3, cradle-to-gate, kgCO₂e/kg)#
| Material | A1–A3 | Source |
|---|---|---|
| Concrete C32/40, 75% GGBS | 0.063 | IStructE, Tbl. 2.3 |
| Concrete C32/40, 50% GGBS | 0.089 | IStructE, Tbl. 2.3 |
| Concrete C32/40, 25% GGBS | 0.120 | IStructE, Tbl. 2.3 |
| Clay brick (single fired) | 0.213 | IStructE, Tbl. 2.3 |
| CLT (cross-laminated timber) | 0.437 | IStructE, Tbl. 2.3 |
| Glulam | 0.512 | IStructE, Tbl. 2.3 |
| Reinforcing steel (UK, recycled) | 0.684 | IStructE, Tbl. 2.3 |
| Steel (world avg., galvanised) | 2.76 | IStructE / Worldsteel |
| Aluminium sheet (Europe, 31% rec.) | 6.58 | IStructE, Tbl. 2.3 |
| Aluminium sheet (world avg.) | 13.0 | IStructE, Tbl. 2.3 |
| Rammed / compressed earth | ≈47.5 kgCO₂e/m³ | Fernandes et al., 2019 |
| Hempcrete (hemp-lime) | can be net negative* | Arrigoni et al., 2017 |
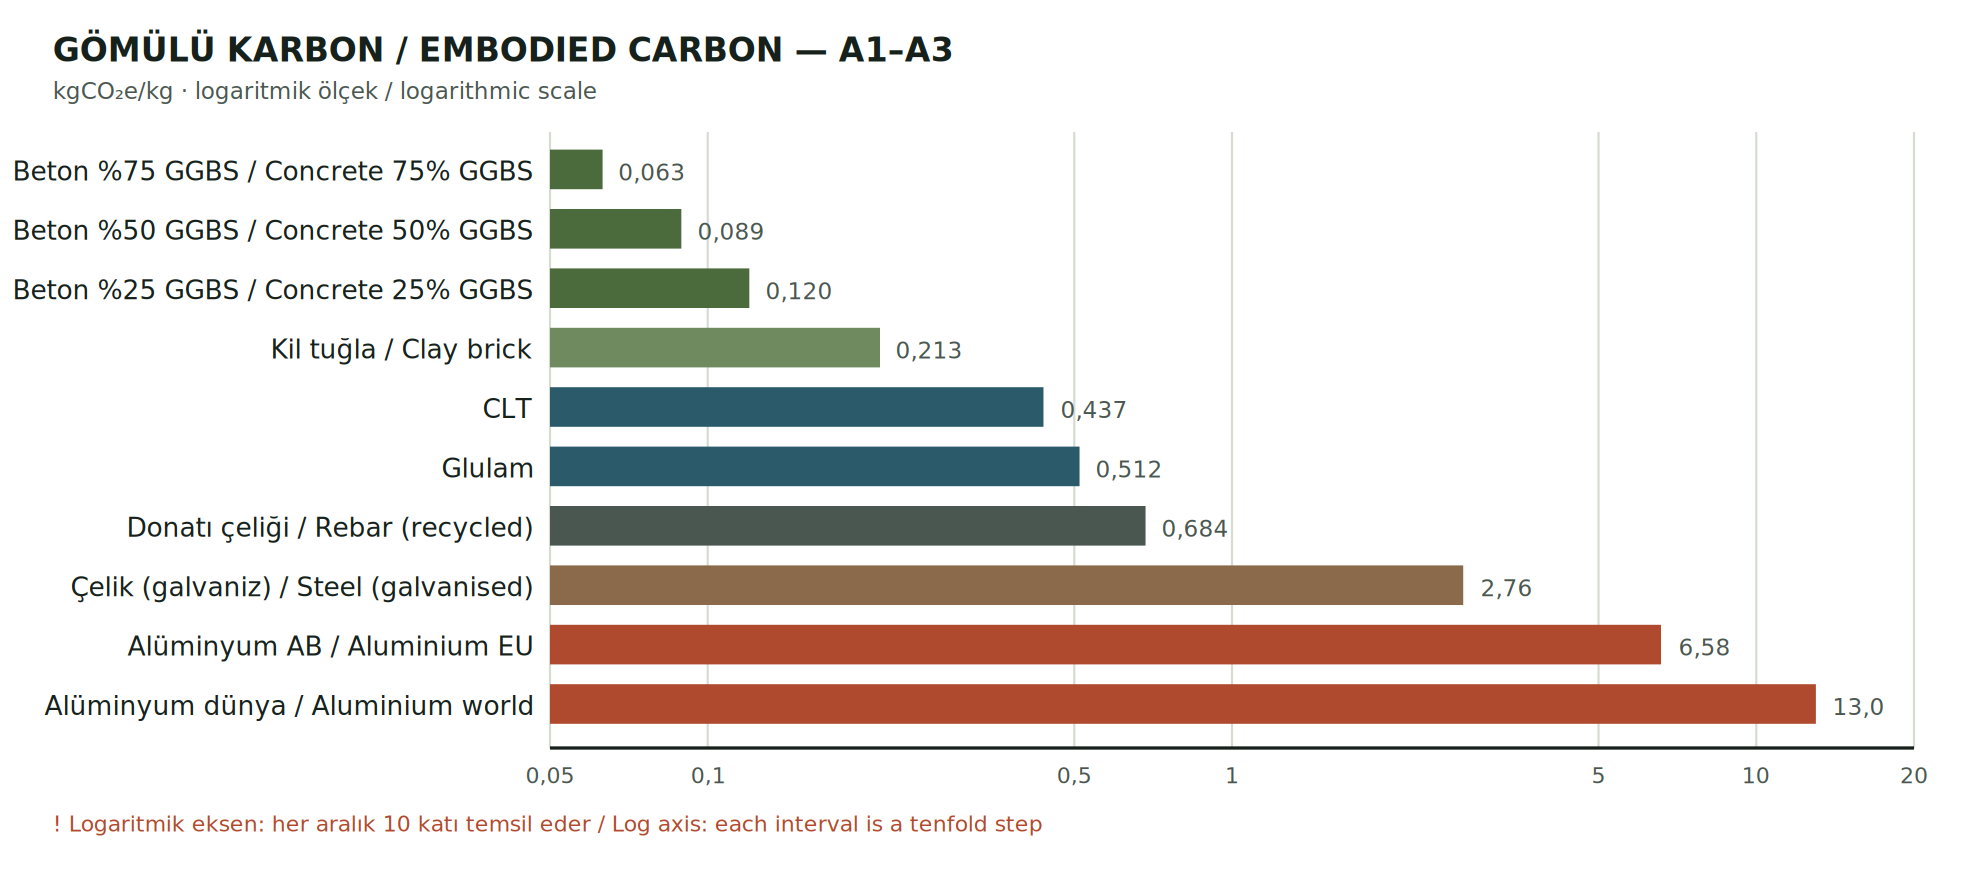
How to read it: figures are per kilogram, but a building uses mass. Concrete looks low per kg yet its large volume can make it a top total contributor; aluminium is very high per kg but used sparingly. Sound decisions multiply factor by quantity, not factor alone.
* CAVEAT — BIOGENIC CARBON. Timber and hemp store CO₂ as they grow, but that storage is permanent only if the material is not burned or left to rot. IStructE recommends a sequestration factor of −1.64 kgCO₂e/kg for timber where product-specific data is missing, but requires it to be reported separately.
Principle 2 — Operational energy#
Per European Commission JRC data, average EU residential use was ≈159 kWh/m²/yr in 2014 (≈124 for space heating alone). By contrast, the Passive House Institute's Passivhaus standard caps annual space-heating demand at ≤15 kWh/m²/yr, renewable primary energy (PER) at ≤60 kWh/m²/yr and airtightness at ≤0.6 h⁻¹ (n₅₀) — cutting heating demand by roughly 90% versus a conventional building.

Table 2 — Operational energy benchmarks (kWh/m²/yr)#
| Building type | Heating / operational | Source |
|---|---|---|
| Existing EU dwelling (avg., 2014) | ≈159 (≈124) | JRC / Enerdata |
| Conventional new home (baseline) | 146 | RIBA 2030 v2 |
| Passivhaus — heating demand | ≤15 | Passive House Institute |
| Passivhaus — renewable primary energy (PER) | ≤60 | Passive House Institute |
| RIBA 2030 target (domestic) | 0–35 | RIBA 2030 v2 |
| Nearly Zero-Energy Building (nZEB) | country-specific | EU EPBD |
* CAVEAT — WHERE 120 COMES FROM. 120 kWh/(m²a) is not the Passivhaus criterion. It is the fallback non-renewable primary energy (PE) limit that applies in PHPP only where no country-specific value is defined. The criterion is PER 60 kWh/(m²a) for Passive House Classic, 45 for Plus and 30 for Premium. Source: PHI, Criteria for the Passive House, EnerPHit and PHI Low Energy Building Standards, v10b, 27.05.2022, Table 1 and footnote 5.
* CAVEAT — VINTAGE. The 159 and 124 kWh/m²/yr figures are measured 2014 consumption, not a design target, and are now more than a decade old.
In Türkiye the envelope is governed by TS 825 'Thermal Insulation Requirements for Buildings'. The October 2024 edition — mandatory from 1 April 2025 — divides the country into six climate/degree-day zones and makes maximum U-values and net energy limits binding together; previously only the energy limit was binding.
Table 3 — U-values of wall and roof assemblies (W/m²K)#
| Element / system | U | Source |
|---|---|---|
| TS 825:2008 wall (zones 1–4) | 0.70 / 0.60 / 0.50 / 0.40 | TSE |
| TS 825:2024 wall (zones 1–6) | 0.45 / 0.40 / 0.40 / 0.35 / 0.25 / 0.25 | TSE (IZODER) |
| TS 825:2024 roof (zones 1–6) | 0.35 / 0.30 / 0.30 / 0.25 / 0.20 / 0.20 | TSE (IZODER) |
| SIP panel, 150 mm | ≈0.21 | SIP Build UK |
| SIP panel, 172 mm | ≈0.15 | SIP Build UK |
| SIP panel, 225 mm | 0.11 | SIP Build UK |
| Passivhaus wall target | ≈0.15 | Passipedia / PHI |
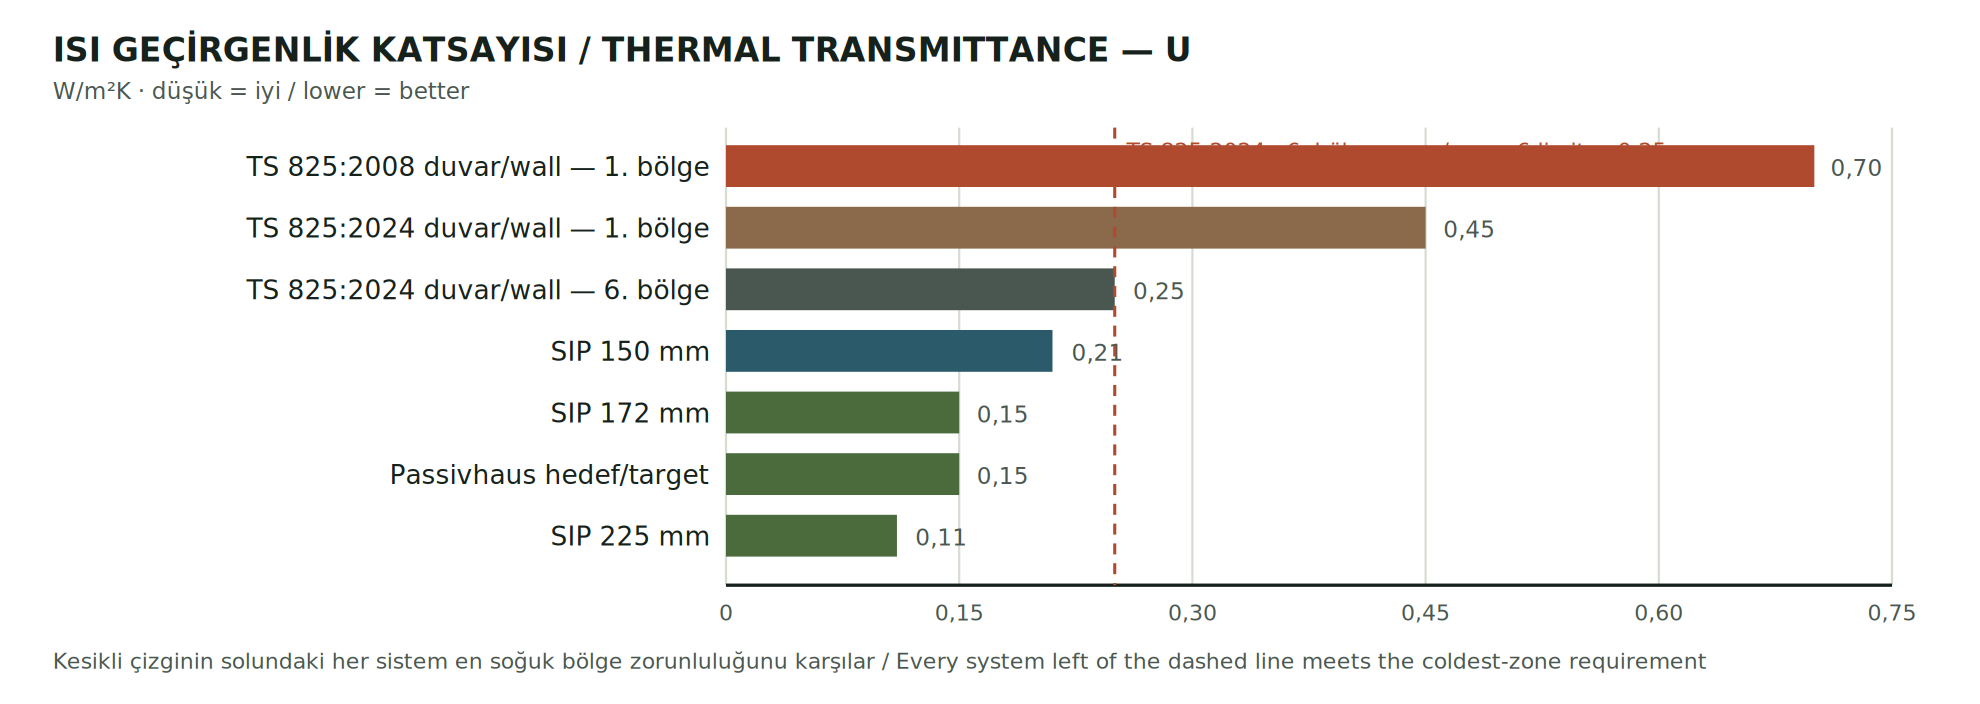
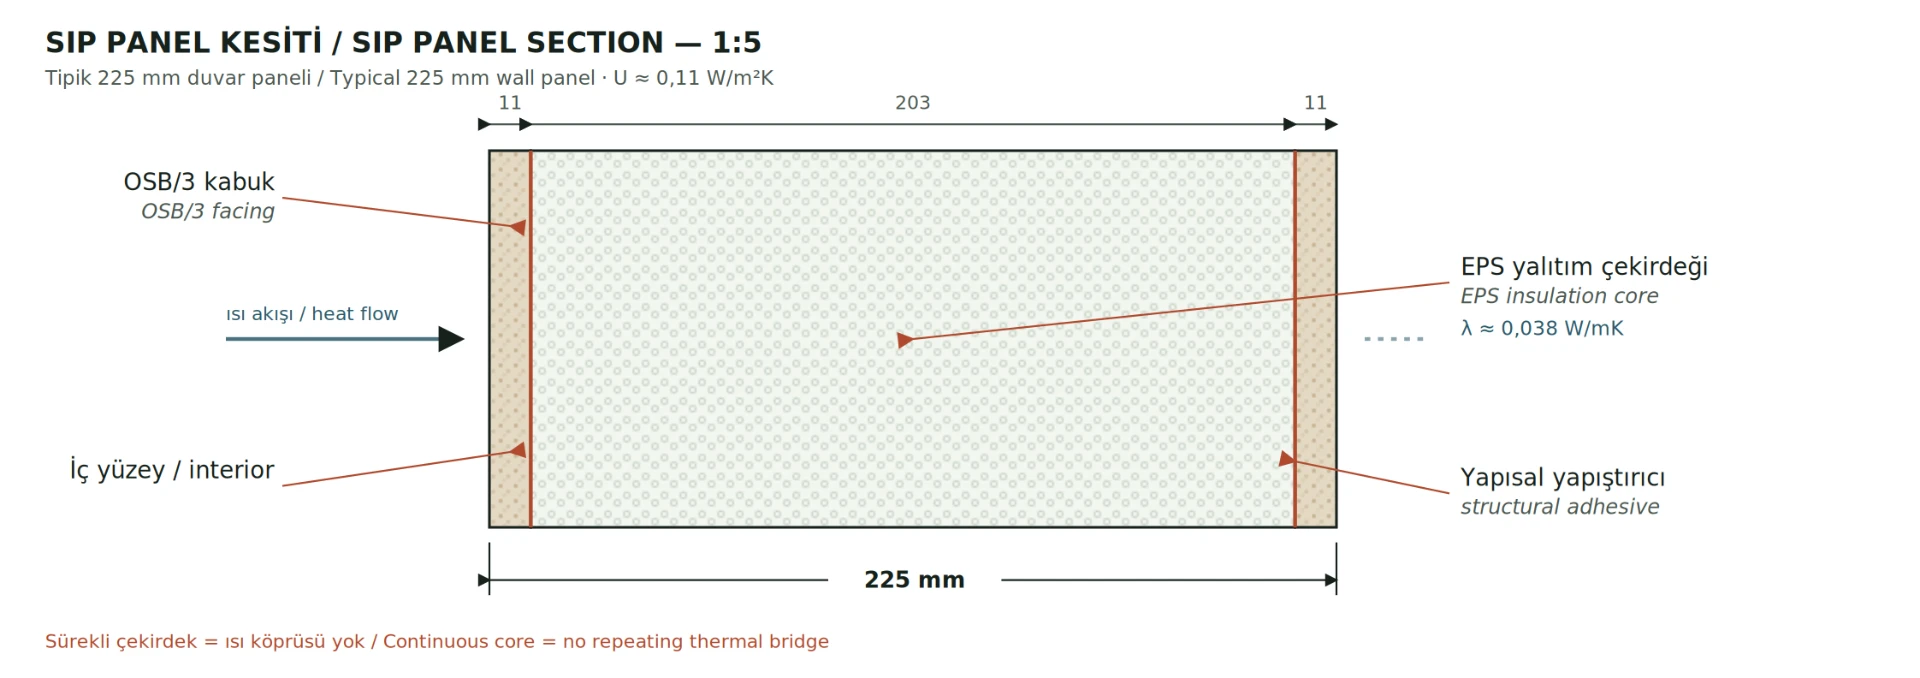
Reading: the 0.25 W/m²K wall requirement TS 825:2024 sets for the coldest zones can be met by a 172–225 mm SIP panel with no additional insulation. A high-performance envelope is no longer a luxury — it is where regulation is converging.
Principle 3 — Waste: modular and prefabricated production#
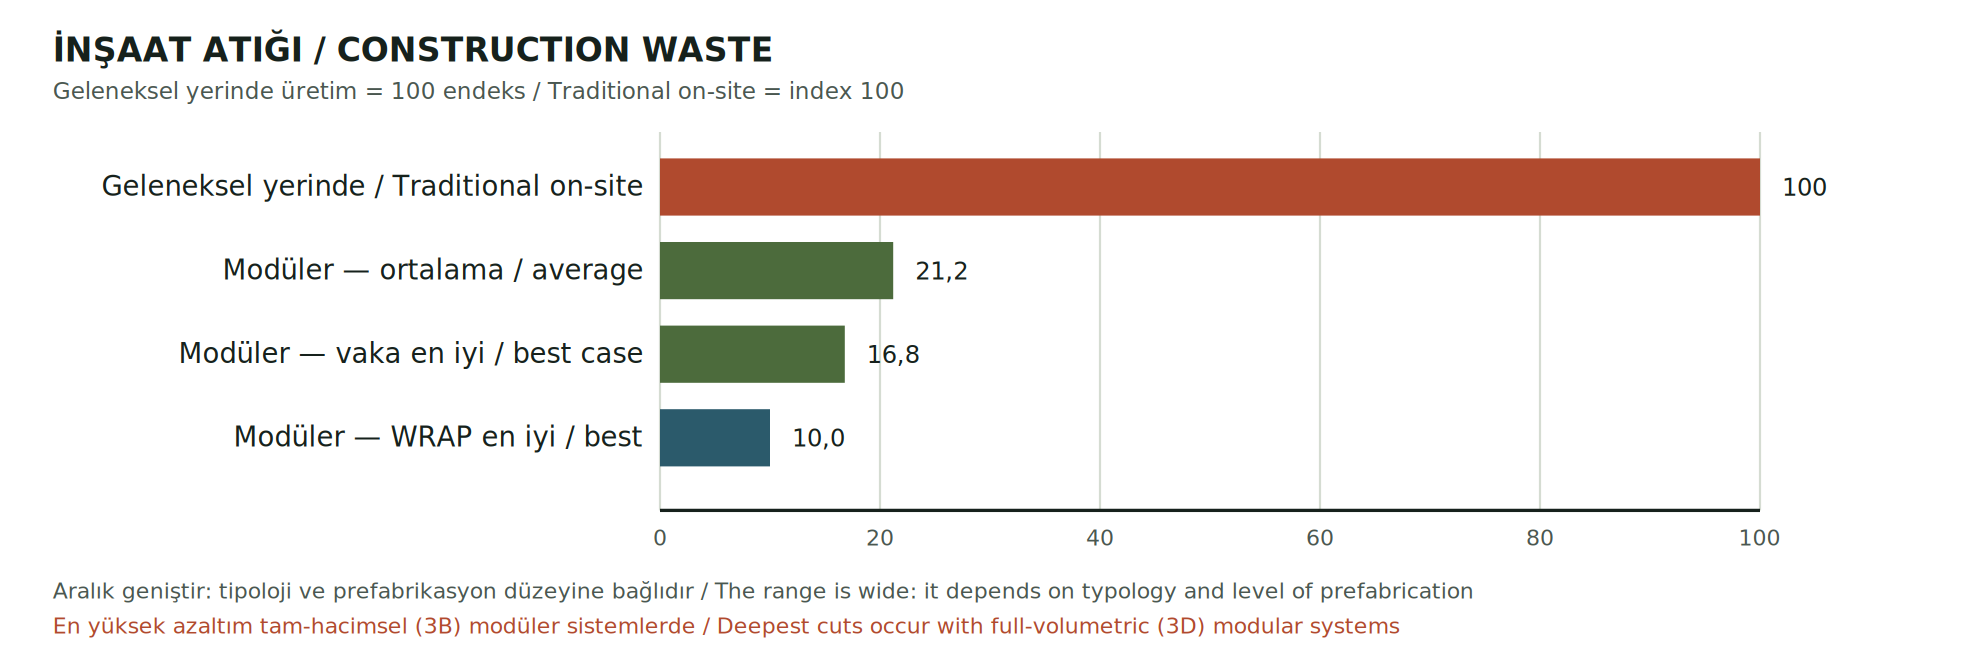
Construction is one of the world's largest waste producers. Moving production from the site to the factory cuts waste sharply through cutting optimisation, quality control and less rework.

Table 4 — Construction waste: traditional on-site vs. modular / prefabricated#
| Method / metric | Result | Source |
|---|---|---|
| Modular construction (59-case average) | −78.8% | Zhang et al., 2024 |
| Modular (by weight, case-based) | up to −83.2% | UNSW / MDPI Buildings, 2021 |
| Modular (WRAP report) | up to −90% | WRAP |
| Material consumption | −15…20% | Univ. of Virginia |
Principle 4 — Circularity: from linear to circular#
The conventional model is linear: extract → make → use → demolish → discard. A circular model keeps materials in use for as long as possible at the highest possible value. Its main tools in architecture are:
- Design for disassembly: bolted and mechanical joints; reversible connections instead of adhesives and mortar.
- Reuse and adaptive reuse: keeping the existing structure. The lowest-carbon material is the one already on site.
- Material passports: recording what is in a building, in what condition, and how it can be recovered later.
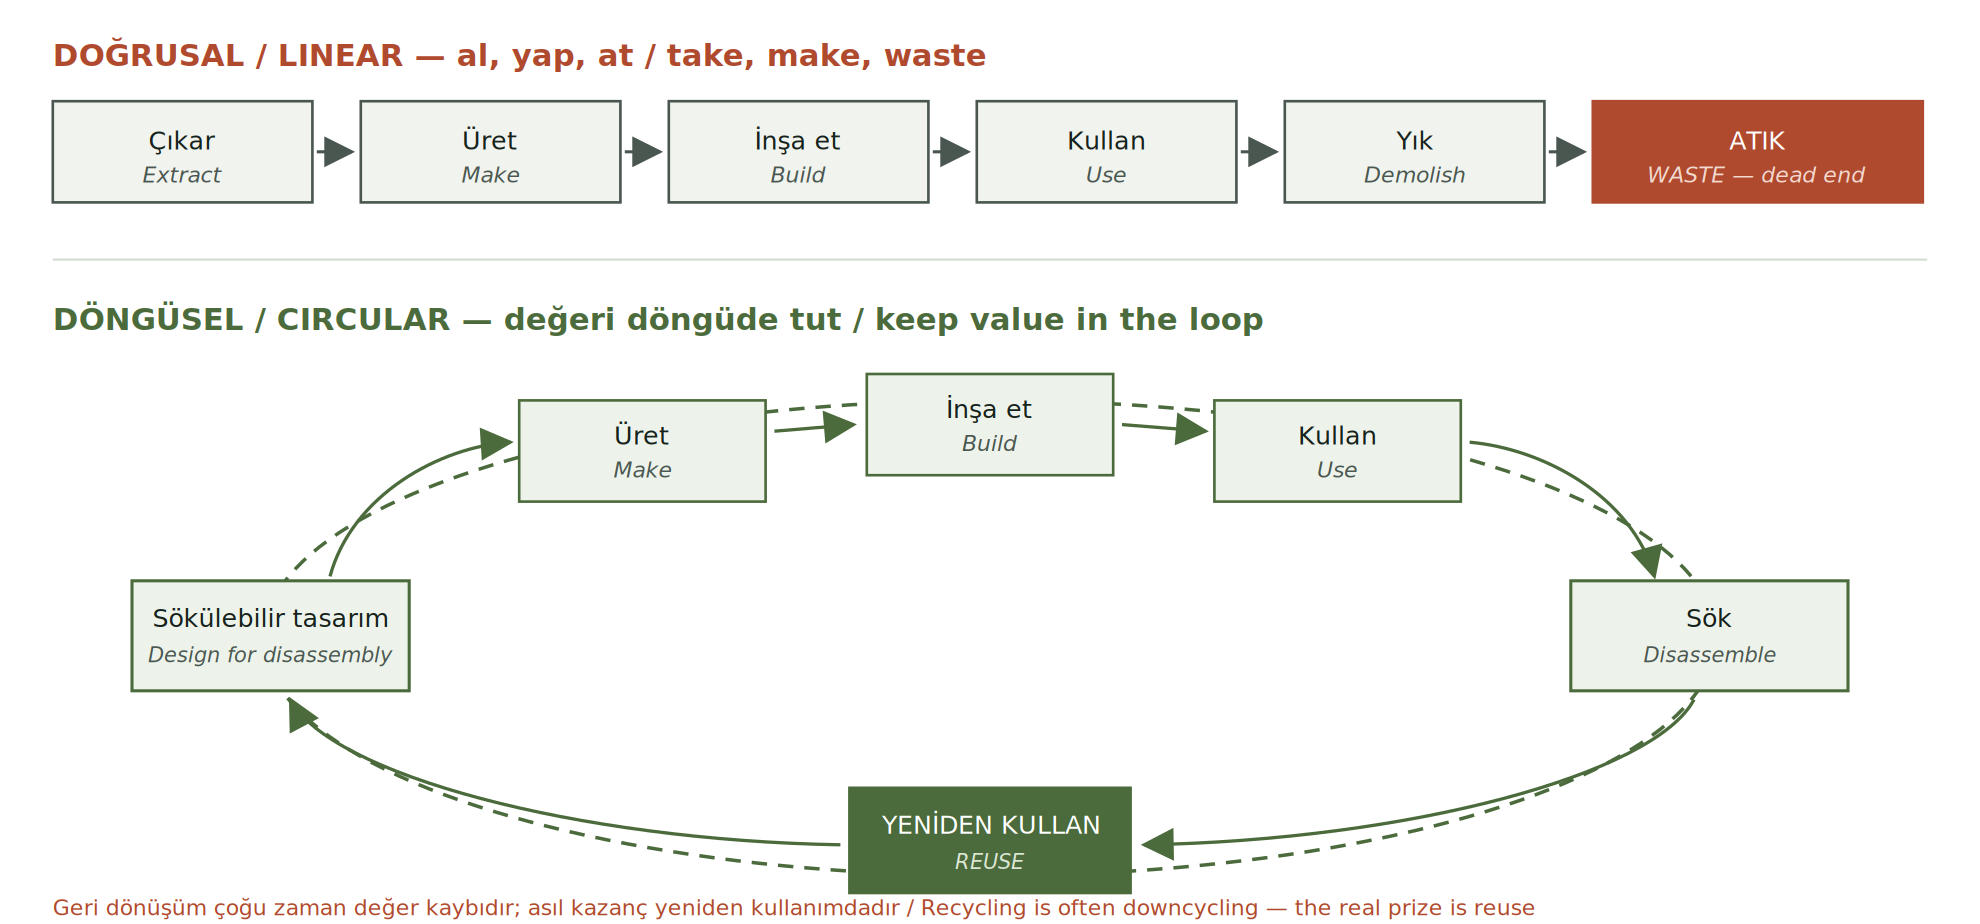
A concrete example: designing heavy-section steel to be reused rather than recycled can cut greenhouse gas emissions by 60–83% depending on the element and project (Berglund-Brown et al., ASCE Journal of Architectural Engineering 31(2), 2025). Recycling is often downcycling; the real prize is reuse.
Principle 5 — The life-cycle view (EN 15978)#
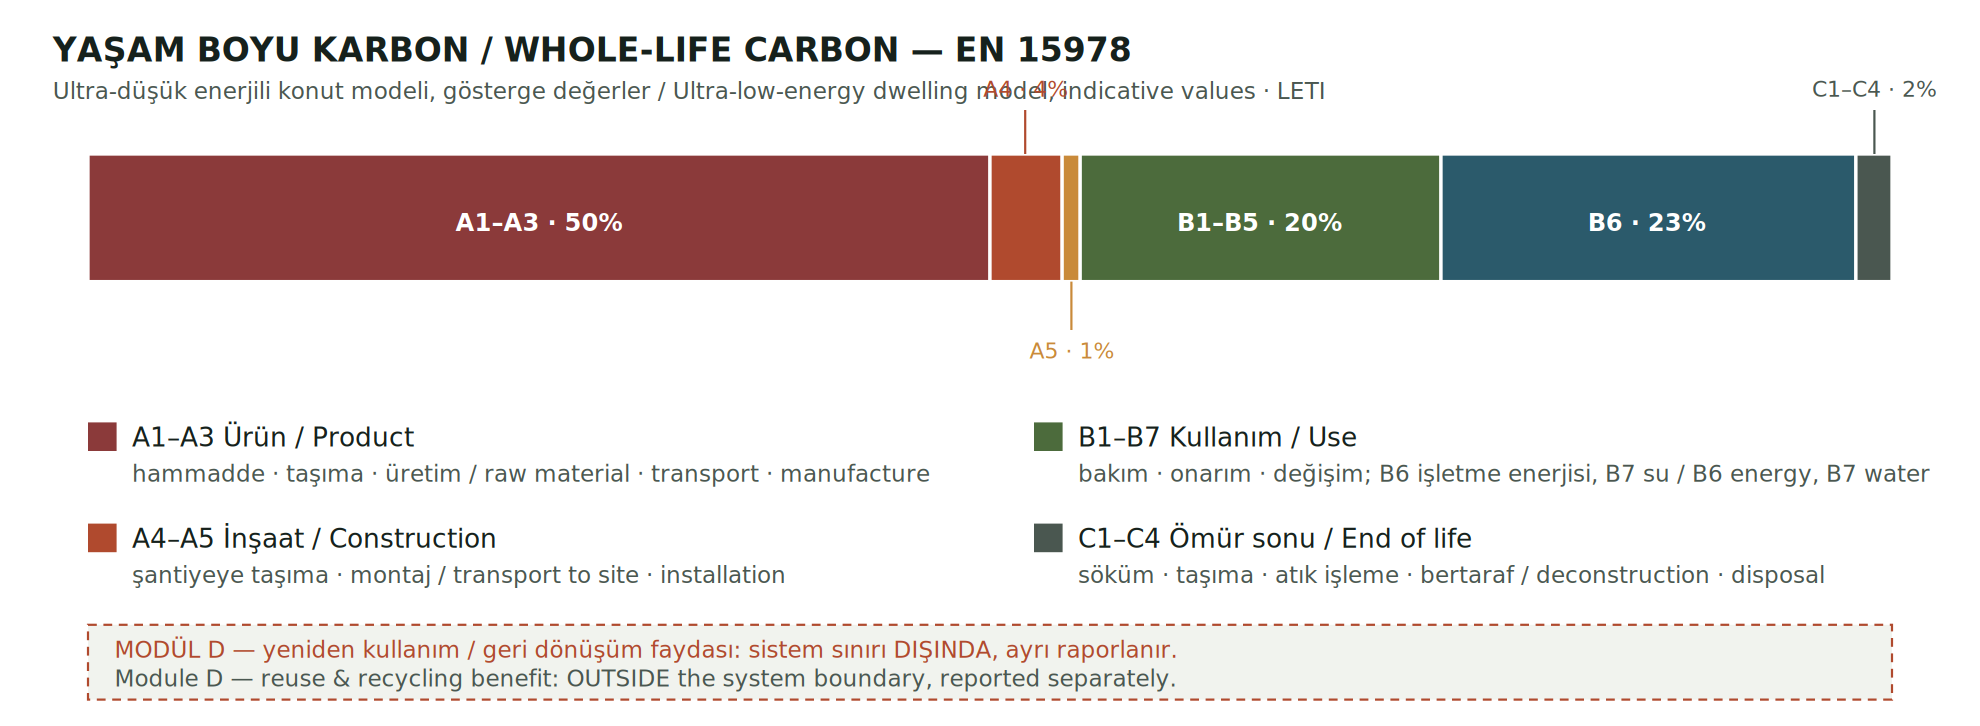
The four principles above converge in one framework: life-cycle assessment. The European standard EN 15978 splits a building's carbon into modules — A1–A3 product, A4–A5 construction, B1–B7 use (B6 operational energy, B7 water), C1–C4 end of life, and D benefits beyond the system boundary.
Fabric first is a principle; passive solar design shows what it means before any mechanical system is sized. A fixed horizontal shading element, sized for the local sun-path angles, blocks the high summer sun from a south-facing window while letting the low winter sun reach the floor slab — no motor, no control system, just geometry. Combined with openings on opposite façades for cross-ventilation, the same three moves — shading, thermal mass exposed to the room, and a through-draught — cut cooling load before a single kilowatt of plant is specified. At roughly 40° north, the shading depth needed is a simple function of window height and the sun's summer and winter altitude angles, and it is worth calculating for the actual site rather than copying a rule of thumb from a different latitude.
The Türkiye context#
Alongside LEED and BREEAM, green buildings in Türkiye are assessed with the local B.E.S.T scheme (ÇEDBİK; first release 2015, version 2.0 in August 2019) and the ministry-led YeS-TR. On the energy side TS 825 and BEP-TR (the energy performance software behind the Energy Identity Certificate) are decisive.
The 19 February 2022 amendment introduced the Nearly Zero-Energy Building definition into regulation; since 1 January 2023 buildings above 5,000 m² total floor area must reach at least energy class B. A building designed to the minimum insulation of TS 825 typically lands in class C — meeting the code is not 'good', it is the floor.
Conclusion — the link to modular and SIP construction#
These five principles reinforce one another, and they intersect exactly where modular and SIP construction is strong. Factory-made SIP panels deliver high insulation (Figs. 3–4: U down to 0.11 W/m²K at 225 mm → Principle 2), low waste through factory precision (Fig. 5 → Principle 3) and fast erection. Modular assembly, with planned and repeatable joints, is natural ground for disassembly and reuse (Fig. 6 → Principle 4).
Our mission at BuildFuture.news is to make these principles legible through numbers and sources rather than slogans — because sustainability is only as real as it is measurable.

Open knowledge — CC BY-SA 4.0. Copy it, correct it, cite it.
Related in the library
Share this