Library · Standards · File 02
Green building certifications: what LEED and BREEAM actually require
Thresholds, credit weightings and the Turkish schemes alongside them — with the contested evidence on whether a certificate means lower measured energy use.
Last reviewed — First publication; thresholds checked against LEED v5 and BREEAM New Construction V7

Fabian Kleiser · Unsplash License
LEED v5: 40/50/60/80 of 110 · BREEAM V7: 30/45/55/70/85% · Türkiye: 71.6% of LEED projects are Gold
A plaque by the entrance saying LEED Gold or BREEAM Excellent tells a visitor almost nothing about how much energy that building uses. Certification schemes score a design against a checklist of credits; measured performance is a separate question. This article sets out what LEED v5 and BREEAM Version 7 actually require, what the thresholds mean, how the Turkish schemes sit alongside them, and what the peer-reviewed evidence says about the gap between a rating and a meter reading.
Two schemes, two arithmetics#
LEED, run by the U.S. Green Building Council, awards points. LEED v5 was ratified on 28 April 2025 and opened for certification on 3 November 2025. A project collects credits out of a 110-point scale and lands in one of four tiers. BREEAM, run by BRE in the United Kingdom, works in percentages: credits are grouped into categories, each category carries a weighting, and the weighted score as a share of the available total decides the rating. BREEAM New Construction Version 7 launched on 30 September 2025. The two arithmetics are not interchangeable — a 60-point LEED Gold and a BREEAM Very Good at 55% are not the same claim about the same building.
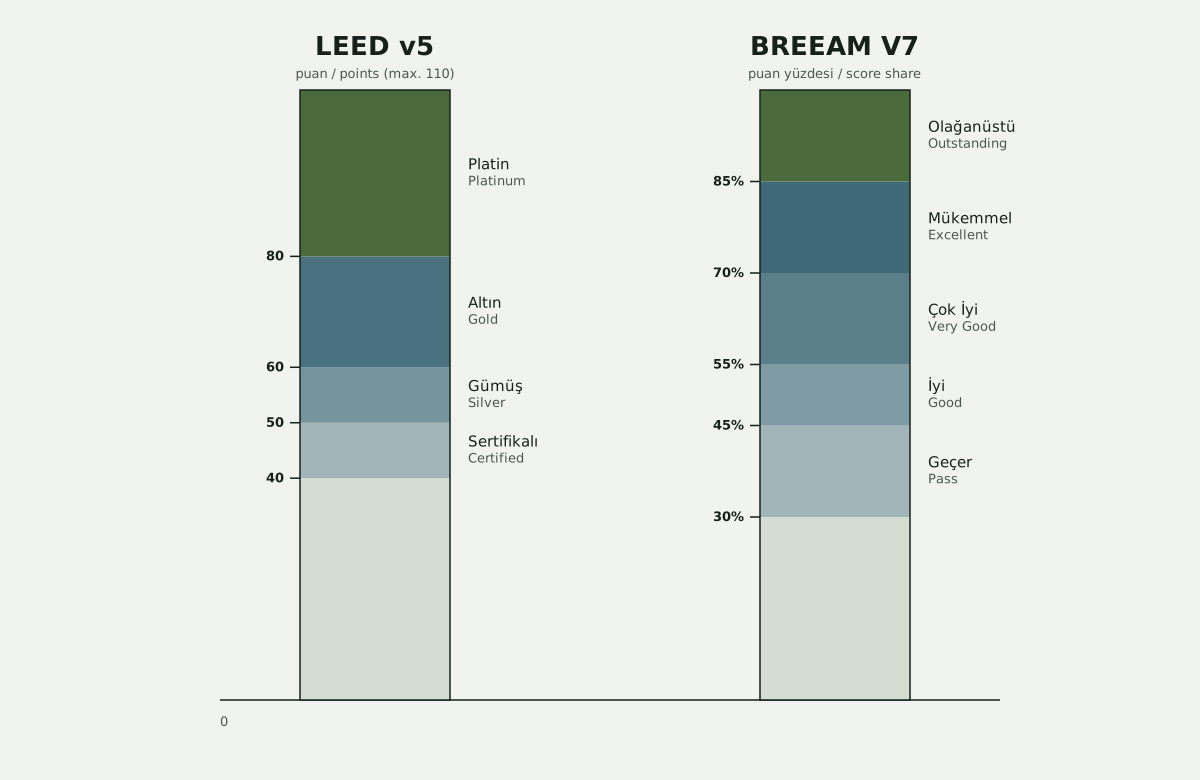
Table 1 — Rating thresholds, LEED v5 and BREEAM V7#
| Rating | Threshold | Scheme |
|---|---|---|
| Certified | 40–49 / 110 | LEED v5 |
| Silver | 50–59 / 110 | LEED v5 |
| Gold | 60–79 / 110 | LEED v5 |
| Platinum | 80+ / 110 | LEED v5 |
| Pass | ≥ 30% | BREEAM V7 |
| Good | ≥ 45% | BREEAM V7 |
| Very Good | ≥ 55% | BREEAM V7 |
| Excellent | ≥ 70% | BREEAM V7 |
| Outstanding | ≥ 85% | BREEAM V7 |
What the credits are actually about#
Both schemes spread their credits across categories, and both put more weight on energy than on anything else. LEED v5 restructured its scale around three impact areas — decarbonisation, quality of life and ecological conservation and restoration — and pulled operational and embodied carbon to the front. BREEAM V7 keeps its category structure and its weightings, with energy the heaviest single category and management, health and wellbeing, materials, water, waste, land use, pollution and transport sharing the rest.
Table 3 — Water, indoor air quality and land: how the two schemes credit them#
| Topic | LEED v5 | BREEAM V7 |
|---|---|---|
| Water | Water Efficiency category: fixture-level indoor reduction, outdoor demand and metering, scored as its own credit set | Folded into the Water category plus cross-links to Management (metering strategy) and Pollution (surface-water run-off) |
| Indoor air quality | Indoor Environmental Quality category: ventilation rates, low-emitting materials, IAQ performance credit (incl. O+M monitoring) | Health and Wellbeing category: ventilation, daylight and acoustics scored together as occupant-health credits |
| Land / ecology | Sustainable Sites category, folded into the Ecological Conservation & Restoration impact area under v5 | Land Use and Ecology category: requires a demonstrated local biodiversity net gain under V7, not just site protection |
How to read it: neither column is "stricter" across the board. LEED separates water into its own scored category with a clear credit list; BREEAM ties water to how a building is managed and drained, which rewards operational discipline over fixture specification alone.

A CREDIT IS NOT A MEASUREMENT. Most credits in both schemes are earned at design stage, from models, specifications and documented process — not from a year of metered data. A design-stage rating is a prediction. Where a scheme offers a post-occupancy or in-use route, that is the version worth asking for, and it is a different certificate from the one issued at practical completion.
Türkiye: two local schemes and one regulation#
Alongside the two international schemes, Türkiye has ÇEDBİK's B.E.S.T (first release 2015, version 2.0 in August 2019) and the ministry-led YeS-TR, published in the Official Gazette on 12 June 2022 as the Green Certificate Regulation for Buildings and Settlements. YeS-TR matters because it is regulation rather than a voluntary market label: it sets the national definition of a green building and the assessment path that goes with it. B.E.S.T is the domestic voluntary scheme, written against Turkish construction practice, Turkish materials supply and the local climate zones.
The distribution of Turkish LEED projects across the four tiers is lopsided. In an academic review of the LEED dataset to March 2025, 624 certified projects break down as roughly 71.6% Gold, 14.6% Silver and 13.8% Platinum, with 42 projects (6.3%) at the base Certified tier not broken out separately. Gold is the market default here, not the exception — which is worth remembering when a Gold plaque is presented as a distinguishing achievement.
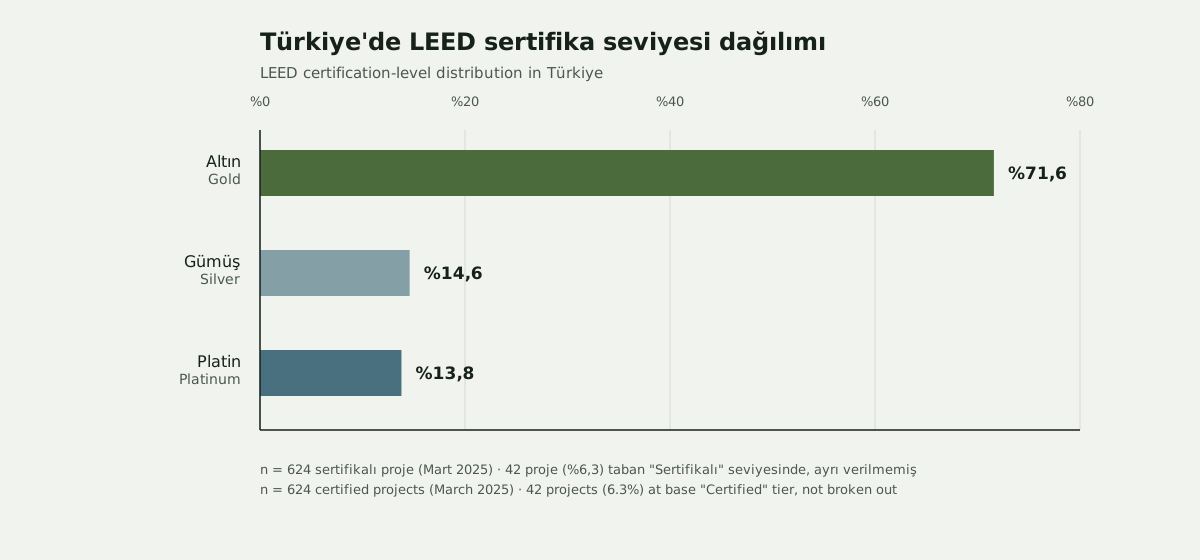
Table 2 — The four schemes in use, at a glance#
| Scheme | Current version | Owner / status |
|---|---|---|
| LEED | v5 (2025) | USGBC — voluntary, international |
| BREEAM | V7 (2025) | BRE — voluntary, international |
| YeS-TR | 2022 | Ministry of Environment, Urbanisation and Climate Change — regulation |
| B.E.S.T | v2.0 (2019) | ÇEDBİK — voluntary, national |

Does a certificate mean lower energy use?#
This is the oldest open question in the field, and it has a genuinely contested literature. The New Buildings Institute study of measured energy in LEED for New Construction buildings (2008) reported average site energy use intensity around 24% below the national commercial stock, but with wide scatter: a substantial share of certified buildings used more energy than their design models predicted, and some used more than comparable uncertified buildings. Newsham, Mancini and Birt re-analysed the same dataset in 2009 and concluded 'yes, but' — an average saving of roughly 18–39% depending on the metric, with 28–35% of the buildings performing worse than their conventional peers.
Scofield, in the same journal and the same year, answered 'not really': weighting the sample by floor area rather than counting buildings equally, and using source rather than site energy, he found no statistically significant saving for the certified stock as a whole. The three papers do not disagree about the data. They disagree about the comparison — which baseline, which energy metric, weighted by building count or by floor area. That is the methodological lesson worth carrying into any performance claim.
READ THE FINE PRINT OF A CLAIM. Before accepting an energy figure attached to a certificate, ask four questions: is it modelled or metered; site or source energy; measured against a code baseline or against the actual local stock; and averaged per building or weighted by floor area. Changing any one of the four can move the headline number by more than the claimed saving.
How to read a certificate#
- Name the version. LEED v4.1 and v5, BREEAM 2018 and V7 do not require the same things; a rating without its version is undated.
- Name the tier, and read it against the local distribution — Gold in a market where 71.6% of projects are Gold is the median, not the top.
- Ask which scorecard carried the points: energy and carbon credits, or lower-cost credits in transport, site and management.
- Ask for metered energy after twelve months of occupancy, and for the disclosure of that data alongside the certificate.
- Check whether embodied carbon was assessed to EN 15978 at all, and over which life-cycle modules.
None of this makes certification worthless. Both schemes have raised the floor of ordinary practice, forced whole-life carbon into project conversations that previously ignored it, and given clients a vocabulary for asking about performance at all. The point is narrower and more useful: a certificate is documentation of a process, and a meter reading is evidence of an outcome. A serious project publishes both — and where they diverge, publishes the divergence rather than the plaque.
Open knowledge — CC BY-SA 4.0. Copy it, correct it, cite it.
Related in the library
Share this